When working with data, there are an enormous number of possible metrics that can be recorded and an enormous number of ways of analyzing them. When developing a work program, researchers and engineers have to decide what exactly they want and are able to measure. It can be detrimental, if not catastrophic, for a lead engineer to realize at a late development stage that a certain measurement was overlooked and that critical data are missing. There must be a plan in place on how the recorded data streams will be used to guide engineering decisions. These are highly non-trivial tasks which require an understanding of data science approaches and techniques to make the best use of measurements which may be very expensive in terms of equipment or operator costs. Machine Learning is a method that is now widespread in scientific and engineering development work. This guide is from Xi Engineering and focuses on machine learning in the field of engineering.
What is Machine Learning?
Machine Learning is an umbrella term for an array of statistics-based approaches for analyzing data where mathematical models are developed to describe what things are or how they work. That’s pretty broad, but these techniques find use in all sorts of fields!
Classification is one important application of machine learning. In classification problems, an object or process may 1) belong to one of a limited number of groups or classes, and 2) have several measurable features that help describe what group it belongs to. One of the most widely used examples for presenting the concept of classification with machine learning is the Fisher’s Iris dataset. This involves data related to three species of iris plants (classes):
- Iris setosa
- Iris virginica
- Iris versicolor
Four particular measurements for each iris sample are taken (features):
- sepal length (green structures that support the petals when in bloom and help protect the flower)
- sepal width
- petal length
- petal width

Based on this information, which in machine learning language is called a feature vector, a wide range of algorithms can be employed to classify which species (class) it belongs to – the response vector. Some important algorithms that can be used for classification problems include Linear or Quadratic Discriminant Analysis (LDA, QDA), Support Vector Machines, Naïve Bayes, Neighbourhood Component Analysis (NCA), K-Means Classification, Decision Trees, or Neural Networks.
One of the key things about machine learning models which make them incredibly useful is that fundamental equations like Newton’s Laws of Motion are often not required or involved at all. Indeed, for cases like the classification of Iris species, no such simple “equation” exists. The same could be said for identifying the make and model of a wind turbine based on windspeed data and gearbox acoustic signature, or in determining credit ratings based on outstanding debt, industry, or working capital.
Text analysis of movie reviews categorizes individual words as “positive”, “negative”, or “neutral”. The words are converted to a machine-friendly format (numbers), and the review is run through a model. The model classifies the review as “good” or “bad”, but it is understood that such a rating is a statistical probability and not necessarily definitive. Furthermore, it isn’t based on any kind of closed-form mathematical equation.
Machine learning models are mathematical structures with parameters that can be tuned via a process called training. Training samples, such as individual iris flowers, are presented to the algorithm; the features of each flower are the sepal and petal measurements. Each feature set is accompanied with a tag telling the model what the corresponding species is (class). This is the ground truth, and is usually prepared by a person. As more examples are presented to the model, the tuneable parameters are updated, gradually yielding better predictions.
If the model misclassifies a large number of the test data points, more training data are taken, and the model is updated again. Indeed, the model is “learning”, just like people do! When we are children, our parents show us pictures of dogs and cats (data points – a feature vector in the form of an image) and tell us what they are (tags – “dog” or “cat”). Our neurons build new connections (update parameters) and after repeating the process many times, eventually we can tell the difference on our own.
Feature Engineering and Clustering of Datasets
When we are presented with a dataset, it’s almost never possible to simply take raw data and feed it to a machine learning algorithm. The data may need to be smoothed, have outliers removed, or be normalized. Additionally, some measured features in a sample simply don’t affect the response as much as others. The number of coffee breaks the average office worker takes in a day doesn’t likely have much effect on the yield rate of the Haber-Bosch Process for ammonia production, but temperature and pressure certainly do. Sometimes multiple features are highly correlated, and thus only one is actually needed. The removal of unnecessary features from a measurement set is called dimension reduction and can help make machine learning processes more efficient, while still providing suitable accuracy.
When samples have many features, it can be difficult to visualize them. Clustering is the process of grouping data points in terms of their similarity to each other. Another classic machine learning dataset is the MNIST collection, containing images of handwritten numbers from 0-9. Each image is a 28×28 set of pixels representing one of ten classes (the numbers “0”, ”1”, ”2”, ”3”, … ”9”); each pixel in the image is a feature, which means this is a sample with 28×28 = 784 features! The irises, in contrast, have four.
So, for the data scientist looking for a way to find groupings and identify correlations, 2D or 3D plots can be made where each axis represents the most important features that define groups. There are techniques to reduce high-dimensional data to 2D or 3D groups, such as t-Distributed Stochastic Neighbor Embedding or K-Means Clustering and these can help reveal local or global patterns in the data that might otherwise not be obvious.
Machine Learning for Regression
Machine Learning isn’t used only for classification tasks, as those described above. It’s also a fundamentally useful technique for regression, which applies where the response variable is a continuous, rather than discrete, quantity. The concepts of classification and regression are actually very similar and several algorithms can be applied (with certain modifications) in both cases.
Curve fitting experimental data to complex fundamental physical equations or sets of equations can be used to help extract features that cannot be directly measured; one example might be the double-layer capacitance in electrical impedance spectroscopy. With multiple time-series or frequency responses, statistical assessments such as 95% confidence bounds can be calculated for the derived metrics.
Where the Machine Learning approach really shows its strength, though, is predicting performance or lifetime where having to resolve individual physical processes might just be too challenging. Lithium-Ion batteries are extremely complex electrochemical systems with several coupled physical processes occurring. Sets of experimentally measured time-series discharge curves from different batteries in different ambient temperatures, for example, can be used to predict future performance with different design modifications or under different operating conditions.
Predictive maintenance is a key application of this idea, such as in estimating the time to failure of a mechanical component. Various time-series inputs may be provided, such as torque profiles, displacement measurements, sound (what’s that weird grinding noise?!), etc… From these data, non-obvious early indicators of component damage may be identified, allowing the operator to take remedial measures before failure actually occurs. Effective use of such techniques can save enormous amounts of time, effort, and money, and can help avoid the chaos of total failures while getting the most out of components.
Machine Learning vs. Deep Learning
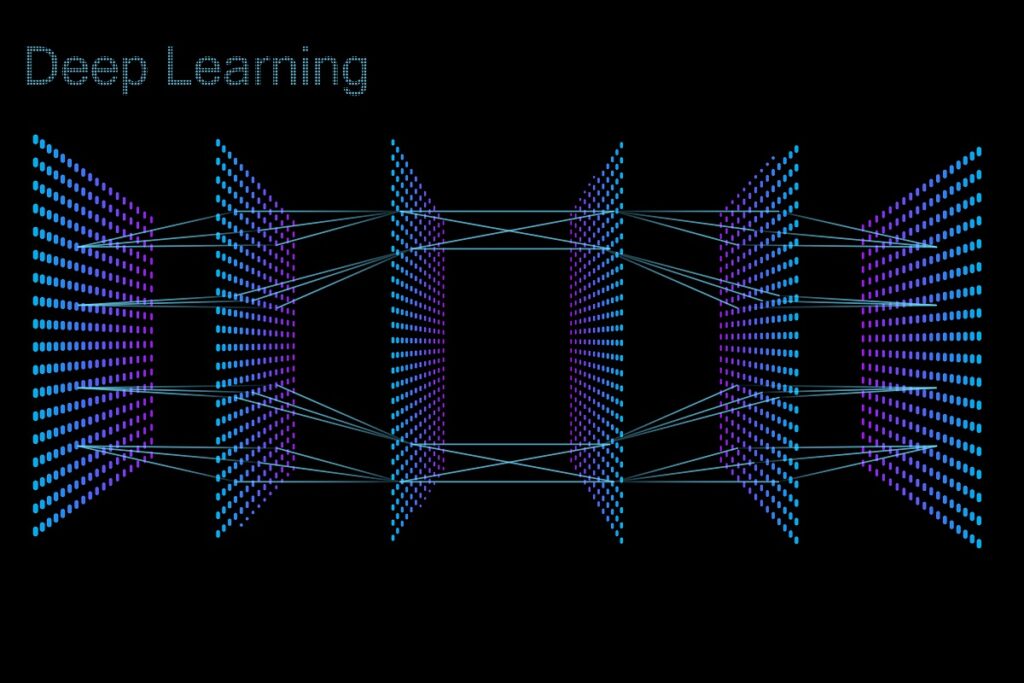
A distinction is often made between neural networks, which are a particular type of machine learning model, and others such as Decision Trees, Discriminant Analysis Models, Support Vector Machines, Gaussian Mixture Models, and Naïve Bayes, to name a few. Neural Networks are often referred to as deep learning models because they typically have multiple hidden layers between the input (such as an image of a number) and the output (the class, i.e. the number “4”) where mathematical operations are performed. As indicated by the name, the connections through which the input data pass when being classified are connected much like biological neurons, and because there are multiple layers of these connections, they are “deep”.

Training with deep neural networks often doesn’t actually require a large amount of user supervision while the model learns, making them particularly useful in image classification, where it may not be so simple to identify particular optimal features in advance to supply as input during training. They often require a large amount of training data, though, and the training process can take time. A GPU is often needed as a practical matter when training on large image datasets. The model file may be large and not necessarily optimized for speed.
The other model types listed above can be slimmer and optimized for speed and size, which is useful for deployment in embedded devices. With the appropriate preparation of the input data, they can often yield good results with much smaller training sets. This means more effort up front is needed in terms of training data pre-processing and feature engineering. The selection of the right model type for the given application and tuning of model training parameters also plays an important role.
As with most engineering tasks, the best approach depends on the task at hand and a good degree of expertise in the specific engineering discipline for data prep, model setup, and interpretation of results.
How Xi Engineering Consultants Can Help
Xi has years of experience in measurement and simulation over a wide range of engineering disciplines. Measurement and simulation by themselves are only useful, however, if the client can understand what the data mean and what concrete actions should be taken based on these conclusions. Xi Engineering Consultants can work with you to help make sense of your data whether you are trying to troubleshoot a failing component, conduct simulations of a new design concept, or simply better understand how your product works. We’re always glad to learn about your projects and goals, so please get in touch.


